Here with several infographics each having a military dimension.
"Information graphics or infographics are graphic visual representations of information, data or knowledge intended to present information quickly and clearly. They can improve cognition by utilizing graphics to enhance the human visual system’s ability to see patterns and trends"
Thanks to the Numberphile Internet web site. Lovers of numbers!
1. "Minard's map of Napoleon's Russian campaign."

"1861 saw the release of an influential information graphic on the subject of Napoleon's disastrous march on Moscow. The graphic’s creator, Charles Joseph Minard, captured four different changing variables that contributed to Napoleon’s downfall in a single two-dimensional image: the army's direction as they traveled, the location the troops passed through, the size of the army as troops died from hunger and wounds, and the freezing temperatures they experienced." Click on image to see an enlarged view.
2. "Napoleon's March on Moscow 3D Space-Time Cube"
Those casualties of the French army invading Russian very well documented. About 500,000 total in the invasion force, 430,000 of which marched on Moscow, only 30,000 making it make alive to friendly territory!! Russian sources report 100,000 men of the invading force taken prisoner and the remainder [300,000] their bodies cremated!!
2. "DIAGRAM of the Causes of Mortality in the ARMY in the EAST."
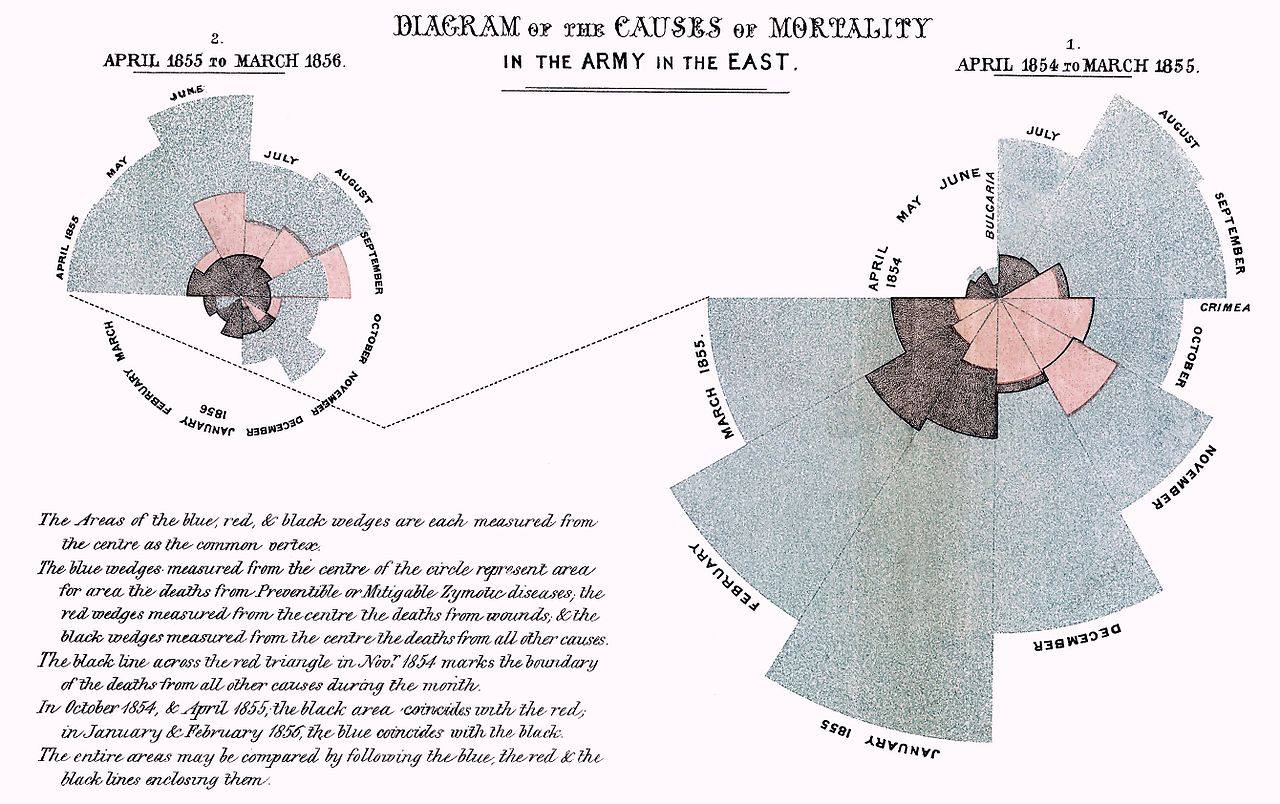
"In 1857, English nurse Florence Nightingale used information graphics to persuade Queen Victoria to improve conditions in military hospitals. The principal one she used was the Coxcomb chart, a combination of stacked bar and pie charts, depicting the number and causes of deaths during each month of the Crimean War." Also click on the image to see an enlarged view.
Queen Victoria was able to understand this infographic? My impression was that the Queen was not the brightest light bulb around. Maybe those closest to her said this was good to go and she just nodded her head.
coolbert.


No comments:
Post a Comment